
HubSpot reporting has gotten a LOT more robust in recent years. They provide a great set of built-in dashboards, but with a little customization you can also create your own reports to drill down and get very specific, meaningful data for your tech company.
What are some of our favorite HubSpot reports at our agency? Glad you asked…here they are sorted by funnel stage.
TOFU (Top of Funnel)
When it comes to the top of the marketing funnel—particularly in the inbound world—marketers are focused on creating content to attract website visitors. The more quality leads you can pour into the top of the funnel, the better chance you’ll have customers at the bottom of the funnel. Good content, full of relevant keywords, helps to generate traffic from search engines and attracts prospects who are in the early stages of identifying their problem and its potential solutions.
How can you tell if you’re attracting quality website visitors and creating the right types of content? Reports that highlight TOFU success show how good you are at generating traffic. These reports focus on things like website visits or views, web traffic source, blog page views and landing page views of your TOFU content (ebooks, white papers, etc.), such as:
——
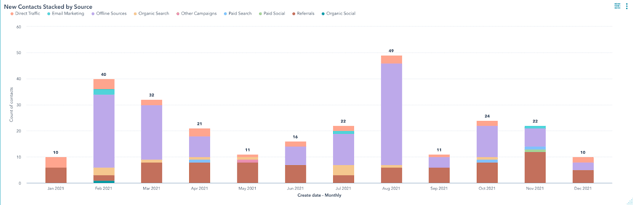
New Contacts Stacked by Source
Contact generation is an important leading indicator of your TOFU performance. One of my favorite HubSpot reports to illustrate which channels are producing the most contacts is the new contacts report broken down by original source. Using this report, you can determine which marketing channels are providing you with the most leads and deserve more investment, and those which might not be worth your time and money.
——
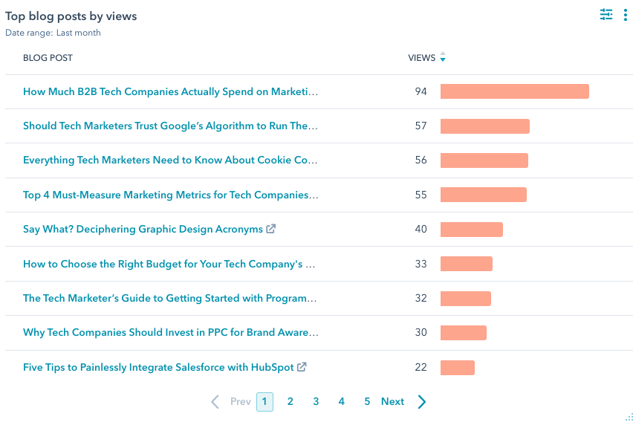
Top Blog Posts (or Landing Pages) by Views
Another useful report is called “top blog posts by views.” It’s great for showing which posts are attracting the most traffic. (A similarly formatted report based on landing page views can show you the success of content designed to drive casual information seekers into the funnel.) From these reports, you can get a feel for the kinds of topics that are resonating with your contacts.
If blog post or landing page views are low, it could mean that either people aren’t connecting with your content or they can’t find it—both of which are solvable issues, but only if you know you they exist!
MOFU (Middle of Funnel)
The middle of the funnel is focused on lead conversion and nurturing. This is where you’re trying to convince prospects to give you their email address in exchange for something of value, and once you have it, educating them with helpful content that brings them closer to purchase. So what reports can you use to analyze this section of the funnel?
Reporting needs here should focus on the performance of your CTAs, forms and the success of your longer-form MOFU landing page content like videos, podcasts and webinars. You can also look at how well email nurture campaigns are moving people efficiently through the funnel by reviewing email engagement.
——
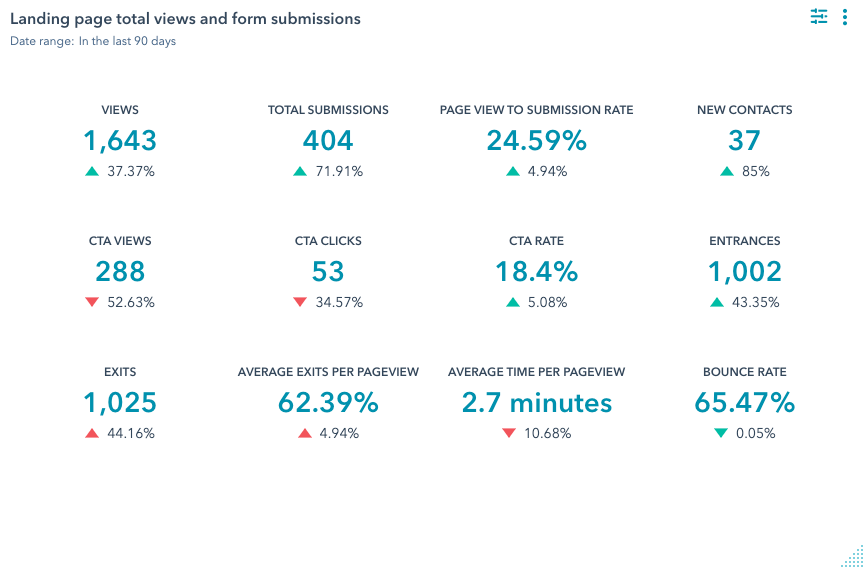
Landing Page Total Views and Form Submissions
A good report that comes standard in the HubSpot reporting library is called “landing page total views and form submissions.” This will give you a snapshot of how your landing pages and forms are performing, with views, clicks, exits, bounces and time on page in one handy card.
——
Email Engagement
There are a plethora of email reports available in HubSpot, both on individual email sends and your overall email health. While the introduction of Apple’s new privacy features has thrown somewhat of a wrench into email performance tracking, there are still some worthwhile metrics to keep an eye on.
HubSpot’s email engagement report gives you the basics to allow you to assess how your nurturing campaigns are performing: sends, opens, clicks and click rate.
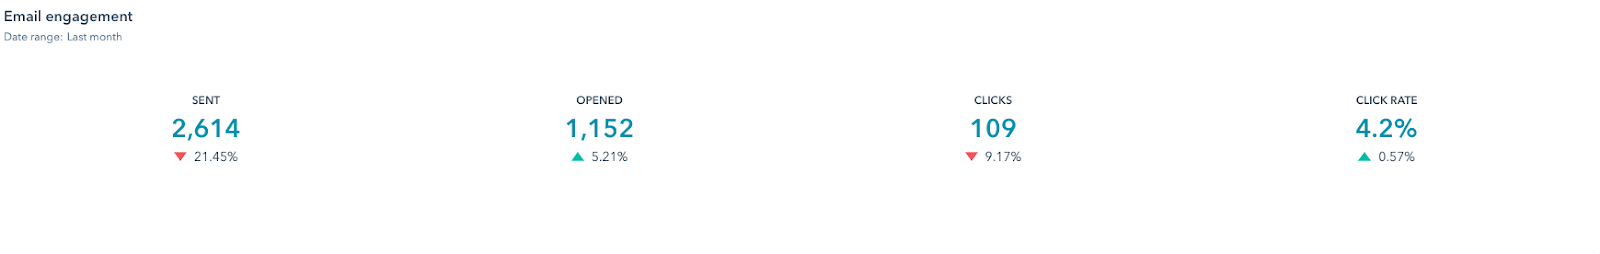
The average open rate for the software and tech industry is around 20%. Anything lower than that suggests that you may need to tweak your subject line or preview text to peak your prospect’s interest. Average CTR for the industry is around 7%. Again, anything lower might indicate that your emails lack interesting content or a compelling call to action.
BOFU (Bottom of Funnel)
Finally, that brings us to the bottom of the funnel. This stage is all about acquiring customers so reporting should be heavily focused on sales (both forecasted and actual) and the performance of your sales team. This could be reports about deal forecasts, sales performance, productivity, deals closed vs. goals, funnel, deals by rep…you get the idea.
——
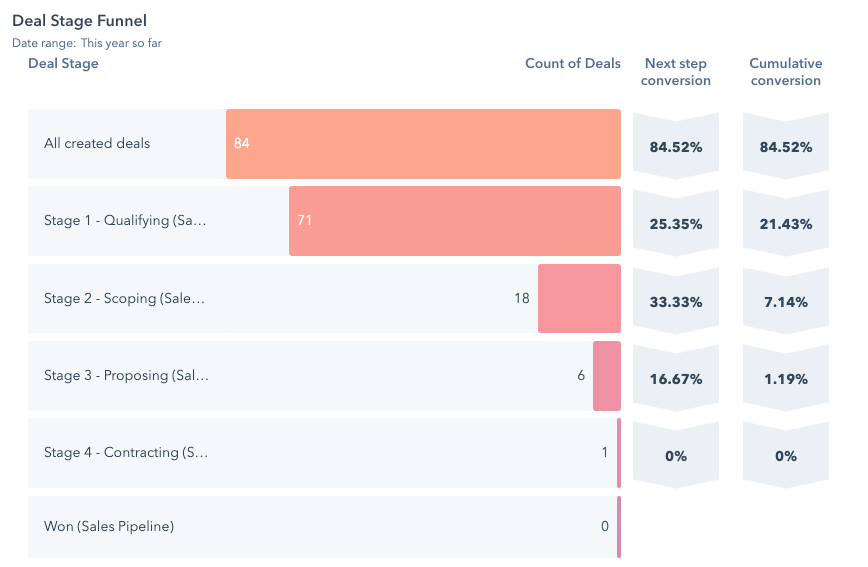
Deal Stage Funnel
The deal stage funnel report is a good report for tracking how deals are progressing through your pipeline (including conversion percentages!).
——
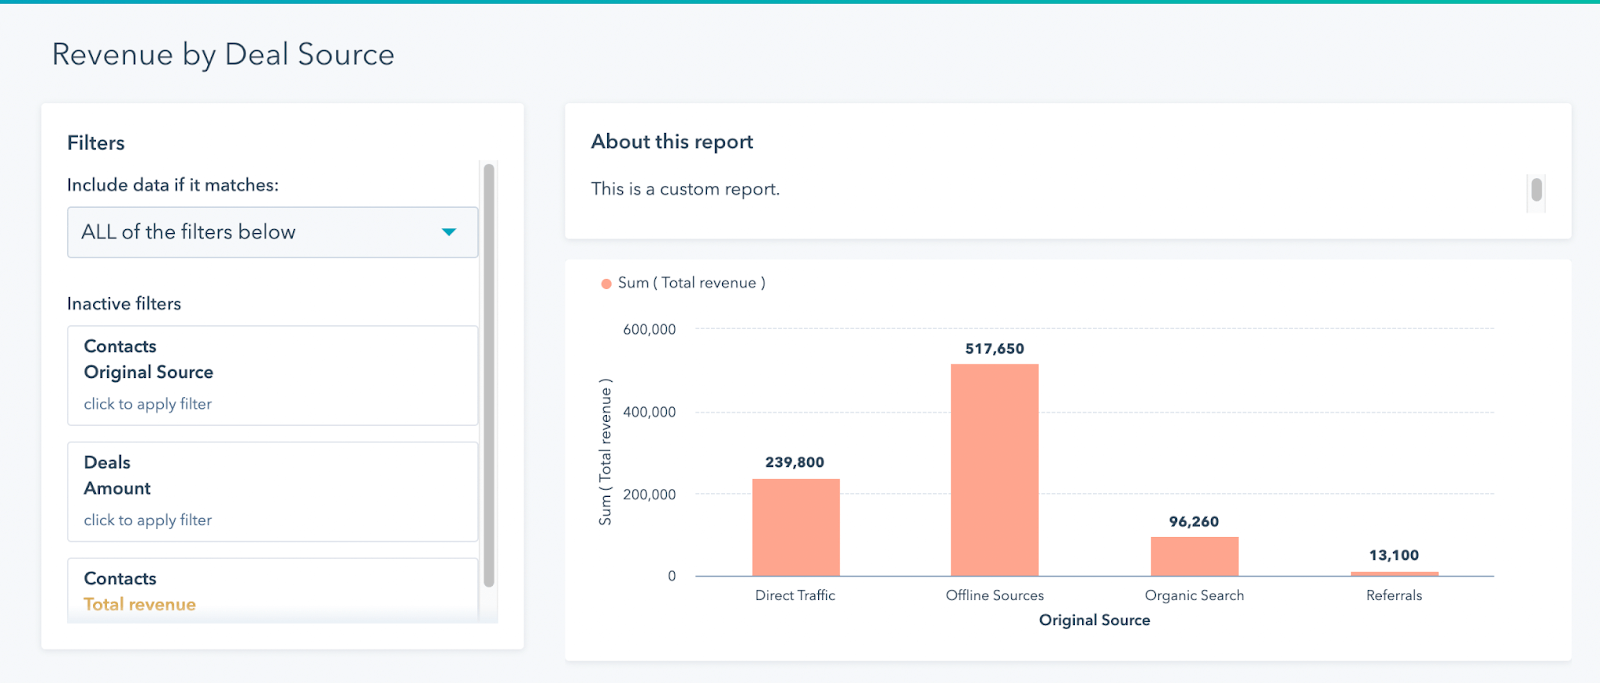
Revenue by Deal Source
Last—but certainly not least—is a report called "revenue by deal source," which shows you which sources (channels) brought in the most revenue. When budgeting, this will ultimately help you decide where to allocate marketing spend.
For example, if you’re putting a lot of money into PPC, but see that it’s producing significantly less revenue than other sources, it’s likely time to either revamp those PPC campaigns or reallocate that money.