
Are you happy with your landing page conversion rate or the number of lead generation channels you use?
Do your strategies perform at the level of the industry median for these metrics, or do you need to put in a lot more work?
We can help you answer these questions and more for you to get deeper insights into the state of your company when it comes to performance within your industry. To do this, we teamed up with Databox to create a HubSpot benchmark group exclusively for B2B SaaS + Tech Companies. With this live, always-up-to-date benchmark study, you can anonymously see how your company stacks up regarding deal and lead quality, as well as landing pages, emails, and website performance.
With data from 360+ companies and growing, this provides great insights into how you are performing across the board. You can quickly discover for which HubSpot Marketing and CRM metrics you are excelling and for which you need to put in more work to become competitive within your industry. Members of the group can even track their performance vs. the benchmark over time, making it easy to see progress or the lack thereof.
The best part?
- It's 100% anonymous and
- It is 100% free
This means that you can compare your data to similar companies within your industry without worrying about anyone sharing it.
Before we share some of the data we compiled, here is how to read the benchmark charts.
How to Read the Benchmark Charts
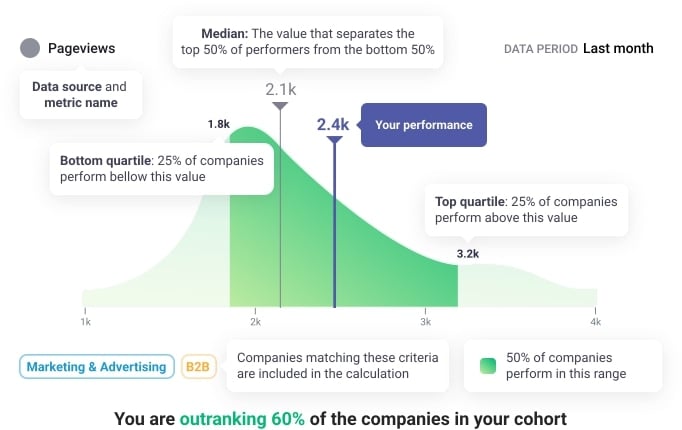
In our Benchmark Group, you will see charts similar to the one below. These are very easy to read if you are familiar with statistical analysis. On the other hand, if this is new to you, it can be confusing, but that is why you can go through this helpful guide and learn how to read it.This chart shows a fictitious company’s performance against a sample of companies.
The blue vertical line represents a company’s performance in the previous month. For this company, it shows 2,400 Pageviews. The chart also shows the following:
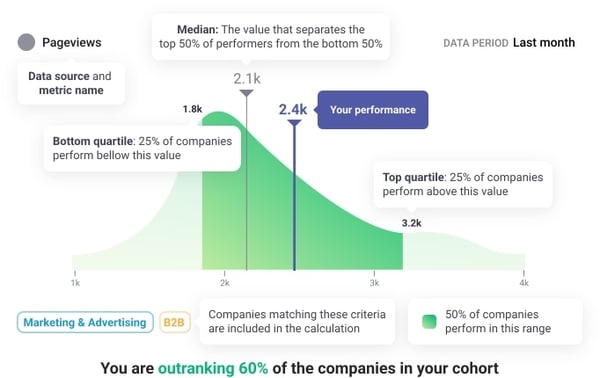
- The bottom 25% of performers for this metric had below 1,800 Pageviews.
- The top 25% of performers had above 3,200 Pageviews.
- The median value is 2,100 sessions, which means that 50% of companies had more than 2,100 sessions in the previous month, and 50% had less.
The height of the green chart shows the frequency at which someone had the value that’s shown on the horizontal or x-axis. For example, in this chart, a relatively large % of the population had Pageviews of around 2,000 last month, as that’s where the peak of the chart is.
You are all set to join the group and read your graphs.
Now, let’s see some of the data from our group.
HubSpot Marketing Benchmarks for B2B SaaS & Tech Companies
Within this group, we focus on data HubSpot CRM and HubSpot Marketing. Let’s first focus on metrics from HubSpot Marketing.The group shares data on a total of 10 metrics.
Eight are the following HubSpot Marketing metrics:
- New MQLs (w/o Offline Source) - Number of new Marketing Qualified Leads generated by online sources only.
- New SQLs (w/o Offline Source) - Measures the number of newly generated SQLs (Sales Qualified Leads) within a specific period, excluding those sourced from offline channels such as trade shows or events.
- Landing Page Submissions - Number of times visitors complete a form or register for an offer on a landing page.
- Landing Page Conversion Rate - The percentage of people who submit a form on a landing page
- Emails Sent - Total number of emails that have been sent from your account to your contacts
- Emails Clicked - Number of times recipients clicked on links within an email campaign
- Page Views - Number of times visitors have viewed a web page
- Contact Conversion Rate - the percentage of website visitors who become contacts by filling out a form
Monitoring these metrics and comparing your data to the industry benchmarks can help shape your marketing and sales strategy and ensure you reach your goals.
So, let’s dive in!
According to our benchmark group of over 360 B2B SaaS + Tech Companies, the median value of the New MQLs (w/o Offline Source) metric for November 2023 was 4. For the Landing Page Submissions, this value was 31, while the median value for Page Views was 9.56K. Finally, the median value for Emails Clicked was 70.
Here’s a chart showing the distribution of Landing Page Conversion Rate values within the group:
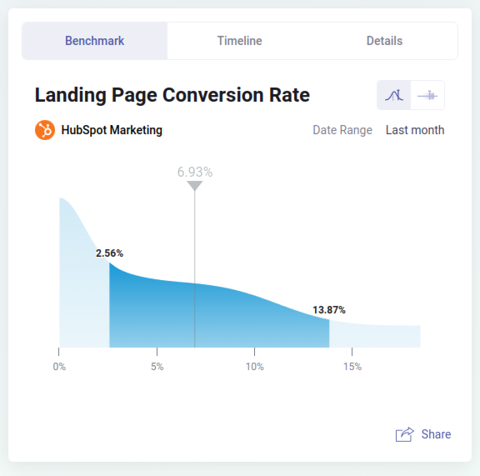
The height of the blue area shows the percentage of companies that have a Landing Page Conversion Rate in that range. As you can see, the height of the chart on the left of the median as the number of Landing Page Conversion Rate approaches zero is very high. This means that lots of companies have very low Landing Page Conversion Rate. In fact, 25% of the sample had between zero and 2.56%, while 25% of the sample had between 2.56% and 6.93%.
On the right side of the chart, you can see that 25% of the companies had between 6.93% and 13.87%, the range is wider in this case. We can also see that 25% of the sample had a Landing Page Conversion Rate higher than 13.87%.
If your Landing Page Conversion Rate is higher than 6.93%, you’re doing better than half the group. To have better insights into your landing pages, you should also consider tracking additional landing page metrics.
As mentioned above, when you join the group, you’ll see charts like this. If it is green, you’re doing better than at least 50% of the sample, it can also be red if you are underperforming, so your Landing Page Conversion Rate is lower than 50% of the group.
Now, let’s learn more about the HubSpot CRM metrics we are tracking within the group.
HubSpot CRM for B2B SaaS & Tech Companies
For HubSpot CRM, we are tracking the following metrics to get a better insight into our sales efforts:
- All Deals - An overview of all deals in the sales pipeline, including the total number of deals, their total value, and their current stage.
- Average Time to Close Deal - The average duration it takes to close a deal, from initial contact to contract signing.
So, let’s look at the Average Time to Close Deal. Now, keep in mind that in this case, the graph is inverted. We want shooter times to close the deal rather than longer. You’ll want your company to be on the left side of the median for this metric. 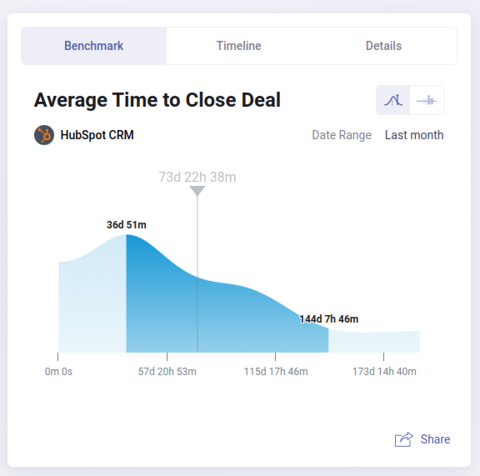
We can see that most companies fall between zero and 57d 20h 53min, with 25% being between zero and 36d 51 min and 25% being between 36d 51 min and the median, which in this case is 73d 22h and 38 min. Now, we would all like to be within the first 25%.
On the right side of the median, we see that 25% of companies have between 73d 22h and 38 min and 144d 7h and 46 min, and the final 25% is over 144d 7h and 46 min. In their case, the chart would be well in the red.
Please keep in mind that your stats will vary depending on your marketing and sales efforts. But don’t get discouraged; dive into the insights and make the necessary changes to hit your goals.
Get More Industry Insights
If you want to know how your landing pages are performing in comparison to other companies within your industry, take part in our State of Landing Page Performance for B2B SaaS + Technology Companies survey. You will gain insights into prevailing outcomes and best practices associated with landing pages.
Here are some interesting insights from over 70 B2B SaaS and Technology companies that participated.
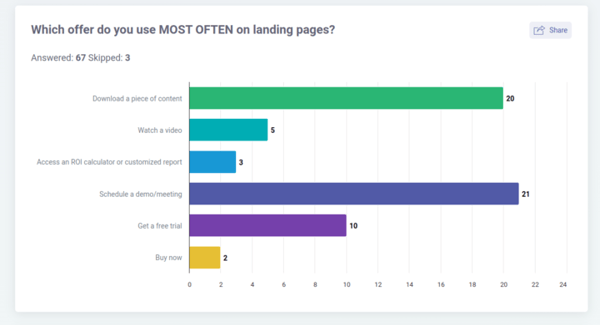
For example, most companies offer scheduling a demo or a meeting on their landing pages as the main offer. A close second is an option to download a piece of content.
What offers do you include on your landing pages?