It’s no secret that COVID-19 has had a huge impact on the economy. As of March 24, 2020, 13 states have executed shelter-in-place orders. As a result, some 167 million Americans in 17 states, 18 counties and 10 cities are either working from home or not working at all. According to the Federal Reserve interview with Bloomberg, the unemployment rate may reach 30% in the second quarter, and we may see an unprecedented 50% drop in gross domestic product.
Some industries will obviously be hit harder than others, but every industry will see some impact—and marketers will be able to see the direct results via Google Analytics and other web traffic measurement tools.
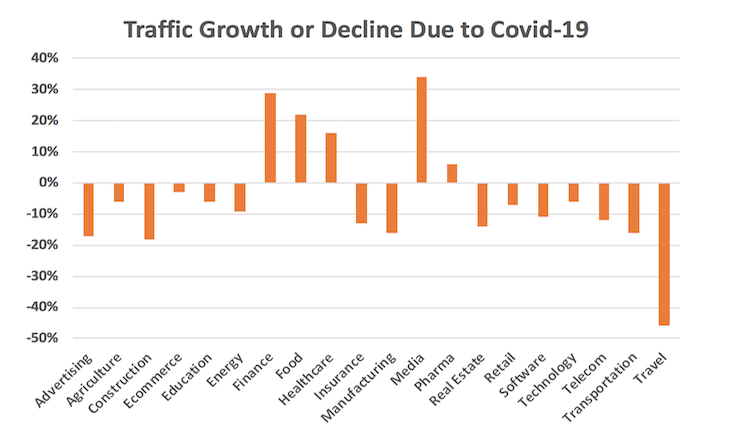
According to SEO blogger Neil Patel, traffic to websites in industries such as finance, food, healthcare and media has grown substantially since the onset of COVID-19. However, industries such as advertising, construction, manufacturing, transportation and travel are seeing huge drops. In the case of travel, traffic has fallen by nearly 50%. The good news? Technology has only experienced a decline of around 6%.

Source: https://neilpatel.com/blog/coronavirus/
Even though the software and technology sectors have not been hit nearly as hard as others, traffic is likely to continue to decline. So, other than panicking and eating all the coronavirus snacks you’ve hoarded, what can you do?
Prepare Tracking
Assuming you’re using Google Analytics, the very first thing you should do is create an annotation. A year from now, you won’t remember the exact dates the virus outbreak happened, but if you’re doing data comparisons, you’ll want to have an explanation for the sudden drops you’re seeing.
Creating an annotation is really simple:
- Log into your Google Analytics account.
- In the bottom left corner, click the “cog” icon to access the Admin page.
- In the “View” column (the last one on the right), click on “Annotations.”
- Click the “New Annotation” button.
- Set the date. You may want to use January 21, 2020 – which is the date the first US case was confirmed. You could use February 20, 2020, which is when cases seemed to begin spreading in the US. Or, you could use the date on which you started to see traffic declining.
- In the “Text” field, enter a note that explains the reason for the annotation, such as “Coronavirus pandemic began.”
- Depending on your permissions in the GA account, you may be able to set the “Visibility” to “Shared,” meaning all account users can see it. That’s preferred, but “Private” will suffice.
- Click “Create Annotation.”
Next, set a benchmark for your organic search. There’s no doubt that Coronavirus and the stay-at-home orders will change things for a very long time. It will be handy to see how organic search terms change as a result. While it’s possible to go back to any point in time in Google Analytics, external reports can help you see things more easily and communicate with other stakeholders. So, now is the time to create a report that shows the search terms driving traffic before the virus hit.
- Log in to your Google Analytics account.
- Navigate to “Acquisition” > “All Traffic” > “Channels.”
- In the list of “Default Channel Groupings,” click on “Organic Search.”
- Open the “Secondary Dimension” dropdown and select “Landing Page.” (This helps you see which page each search term drives people toward.)
- Expand the number of visible rows to see a substantial number of unique terms. (This will vary for each site, but 100 is generally a good number.)
- At the very top of the page, click “Export,” and choose either “Excel” or “CSV.”
- Save the resulting file.
Lastly, remember where you saved this file so that you can compare it to your results in six weeks, six months and a year. The insights you gain from this comparison may help you recognize weaknesses in your site or may help you pinpoint pain points exposed by the pandemic for your target market. For example, security companies may find an uptick in searches involving contingency planning. Companies offering remote technologies may find more searches related to “work at home,” etc.
Update Your Availability
Some organizations were more prepared to work from home than others, but almost no one was completely prepared for entire offices to shut down. Consider how customers or potential customers might be trying to contact you, and what the result will be now that no one is physically holding down the fort. If your website doesn’t provide clear answers about your availability during the crisis, visitors may bail quickly, resulting in higher bounce rates and lower traffic overall.
Take a hard look at all of your communication channels and see how they are weathering this storm. Are all emails operational and being responded to? If you have a live chat on your website, is it still being manned as normal? Are phone calls routed to workers who are available? Are support tickets still being worked and closed at the normal rate?
If any of these things are not functioning as they should, don’t panic. Most customers will be fairly understanding, as they are going through the same things themselves. However, being proactive by sending an email, posting information on your website, or even personally reaching out to customers to explain the situation will go a long way toward building or maintaining credibility and trust…and keep people coming to your site.
So, take the time now to adjust your communication channels as needed. If you are used to receiving a lot of phone calls and no one is there to answer the phone, update your greeting to direct callers to the website. Then, be sure your site offers some clear guidance on the best way to reach you. Consider adding a banner to your home page (or at least to your contact page) indicating how business hours may be different, what email addresses or forms will route people to workers who are still on duty and how wait times might be different.
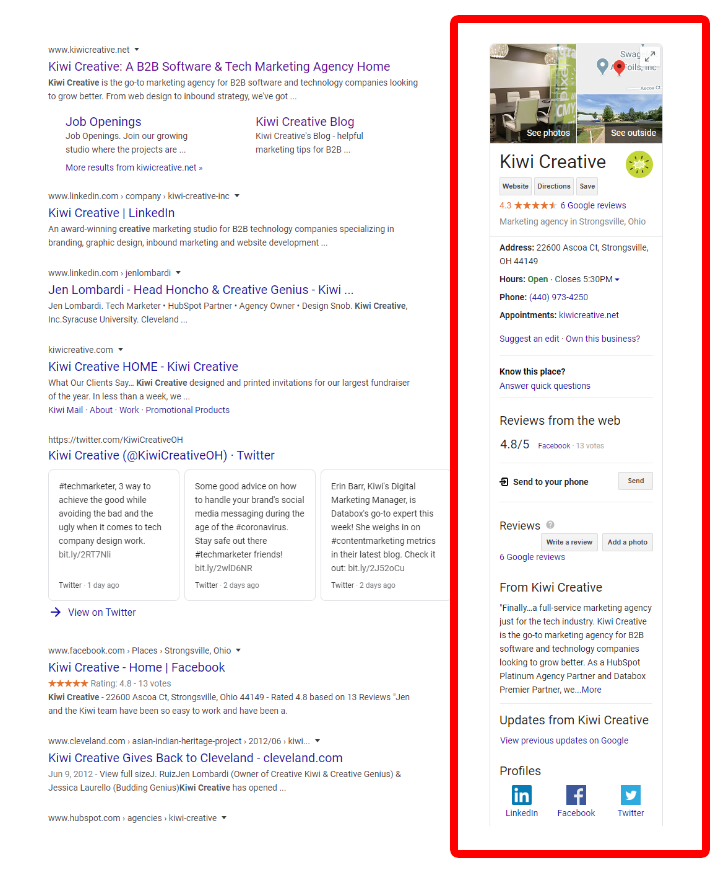
On that note, if your operating hours have changed because of shelter-in-place orders, update your Google My Business listing.
If you’re not familiar with Google My Business, now is the perfect time to learn! Your GMB account is a tool that allows you to manage the data that appears on the right sidebar of a Google search results page. Kiwi’s listing looks like this:

To manage your GMB account, go to https://www.google.com/business/. Once signed in, you can click on “Info” on the right to update your business hours. Google provides a place for you to indicate your normal hours and “special hours.” However, Google is recommending that you update your normal hours. Just be sure to set a reminder for yourself to change them back once things are back to business as usual. If it’s relevant, you can also indicate that your business is “temporarily closed.”
An important note about GMB changes: Google’s own quality team has been limited by the pandemic, so they are warning that changes may take longer than normal to appear in the search results.
Fight Back
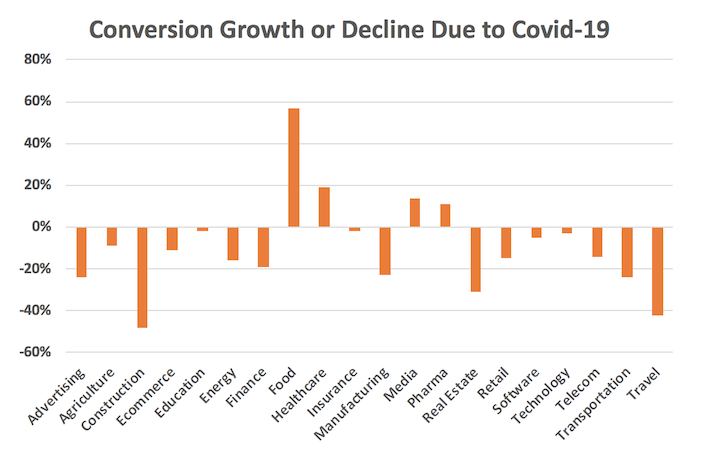
This situation does not have to be all doom and gloom for marketers. In fact, Neil Patel reports that, while conversions have dropped in most sectors, they are not falling nearly as rapidly as traffic. In the software and technology sectors, conversions have only fallen about 2%.

Source: https://neilpatel.com/blog/coronavirus/
As people are working from home, many are finding more time in their schedules to research, learn and explore—and that means that more people may be entering the research phase of your sales cycle. Don’t drop the ball and let those leads get away!
Now is the time to double-down on your efforts to capture visitor information, provide educational content and start nurturing those leads with drip campaigns. In fact, many business experts say the time is right to ramp up your digital advertising spend. Particularly for tech companies, whose services might actually be more useful during the current rash of OOO messages, spending more now may help you to outrank your competitors later. Taking strategic advantage of others’ budget cuts can positively impact your own brand awareness and search rankings.
Research firm eMarketer has lowered its outlook for ad spending, but they are still expecting overall increases, and they assume things will pick up by the end of the year based on models of data from Chinese marketers. Analyst Brian Lau also pointed out that “The impact is less severe than traditional media, mostly because mobile ad spending is still showing strong growth. This is in part because people are shopping online more during the outbreak. They are also turning to online news sources for information about the outbreak. These factors will buoy advertisers’ appetite for digital ads.”
According to a survey of 160 US marketing professionals by Wyzowl, 48% expect their budget to be cut, but 46% expect it to be unaffected, and a very small percentage (1 in 20) report that they actually have extra budget. The majority of respondents are redirecting their budgets toward digital channels, including video, paid ads and broadcast advertising.
The takeaway? Cutting your budget or decreasing marketing activities now is not the smart move. Instead, use social media to connect with your customers, use PPC to drive traffic to your website, use this time to create great content that will help you rank, and spend some time planning for the inevitable surge when the quarantine ends.
Times are scary and that fear may be reflected in your website traffic statistics. However, taking a few simple steps now will help future you understand what happened in Google Analytics, help your customers trust that you’re still operating with the same work ethic as usual, and set you up to beat competitors who panic. Stay the course, plan head and work remotely!


