


Want more money for your marketing campaigns in next year’s budget? At many tech companies, that means overcoming the stigma that marketing is just a cost center necessary to do business.
The problem? Tech marketers know that their efforts are a long-term game involving brand awareness and lead nurturing.
The C-suite, on the other hand, wants to see immediate ROI with leads turning into sales.
Since our most recent survey revealed that 80% of tech marketers have to report marketing-related metrics up the chain of command to someone in the C-suite, think of this blog as a how-to guide to creating killer reports that will resonate and non-marketing leadership.
Step 1: Think like an executive
Want to present killer reports to your CEO or CFO? Go back to Marketing 101 and put yourself in their shoes.
You personally may care a lot about email click rates or landing page views, but a C-suite executive does not. Fair? Of course not…if someone isn’t ready to buy today, that doesn’t mean they won’t want to buy from you tomorrow.
Alas, a CEO cares most about increasing revenue and maximizing profits…so KPIs they’ll get excited about revolve around:
- How many leads did marketing generate? For example, # of new MQLs or SQLs in a specific time period.
- How many leads converted into customers? For example, lead-to-close ratio (LTCR).
- How much did it cost to obtain/convert those leads? For example, cost per lead (CPL) or cost per acquisition (CPA).
- How much money did those customers bring in? For example, customer lifetime value (CLV).
By talking in “C-suite” speak, they’ll better understand marketing’s importance to the overall business goals…win!
PS: Want a little extra help calculating CEO-approved metrics? Check out this neat (and free) sales metrics calculator from HubSpot.
Step 2: Keep it short and sweet
It’s easy to get caught up in the details of your reports. You can spend hours analyzing metrics and—like a proud parent—you want to show off every bit of data you’ve collected.
However, too much info can quickly overwhelm a CEO who doesn’t understand technical marketing lingo.
For example, imagine saying in a reporting meeting, “the CTR on the PPC campaign was 10% higher than last month AND the LP bounce rate was down 25% because of our new A/B split test…isn’t that great?!”. Would your boss’ boss’ boss understand what that means?
Just like website visitors want to quickly scan content for the most important pieces of information, busy C-suite executives want just the most important highlights. Using big words or fancy acronyms doesn’t make you sound smarter…it just causes people to either tune out or become confused.
A good rule of thumb? If it doesn’t showcase how your efforts are influencing revenue, leave it out.
Now, should you still know all of those supporting details behind the scenes? Of course! You want to be prepared if the CEO asks you for further insight, but leave them off of the presentation deck.
Step 3: Include impactful visuals
Even a numbers-driven CEO can go cross-eyed looking at tiny rows of spreadsheet data in a PowerPoint presentation. To make your deck more impactful, be sure to include visuals that drive home the importance of the data.
Hopefully, you’re already including some basic charts and bar graphs in your deck, but here are some visual examples of how our designers have spruced up reporting decks in the past.
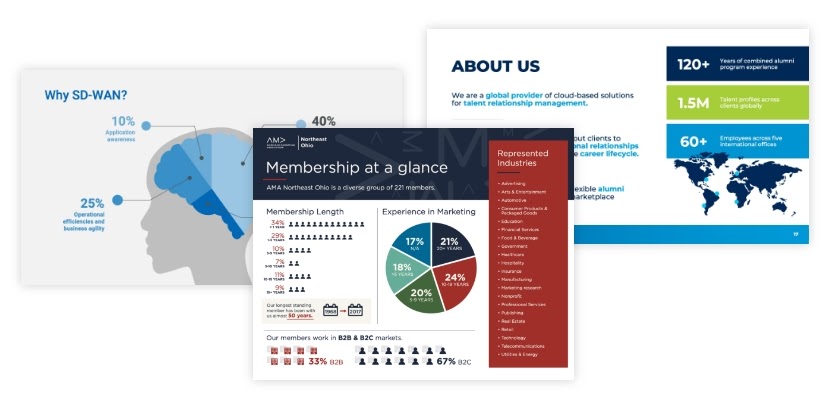
Visuals like these—combined with your stellar storytelling skills—will bring otherwise boring data to life…and make you a rockstar reporting legend.
