


Somewhere around 4 million days ago…you know, at the beginning of last month…you were probably thinking about your short term marketing strategies and scrambling to do things like post a message about your operating hours, cancel travel to trade shows, and figure out how to turn off that potato filter on Zoom.
Now, the crisis hasn’t completely passed, but you may have gotten more comfortable with the “new normal.” That means it’s time to start thinking a little longer term and determining your marketing plans for the rest of 2020. While it may feel like you are in completely uncharted waters, you can still turn to data to help you determine your path forward.
The most important thing to remember is that you must continue to think long-term, even while making quick pivots. That’s because hasty decisions driving by panic over finances can lead to bigger problems later. According to both AdWeek and Forbes, multiple long-term studies using data from thousands of companies showed that businesses that lowered ad spend during a recession saw “sales and income fall by 20-30% over the next two years as a result.”
Rand Fishkin, founder of software firm Moz and market research startup SparkToro, said it best when he tweeted, “Have to make marketing cuts? Don’t use a sledgehammer, use a scalpel. Otherwise you could cut revenue-generating channels and spend…Revenue that’s saving people’s jobs.”
These five data-centric tips can help you make better marketing decisions.
1. Filter out the remote workers
If you’re going to use Google Analytics to make decisions based on data -- and you should -- you first need to ensure it’s as clean as possible, so it’s a good time to look at your setup and configuration.
One thing that might have changed and impacted your traffic? Employees working from home and accessing the website. If you filtered internal hits previously, and employees are now external, your traffic may be inflated.
If workers are all on different internet providers, it might be tough to filter them out. However, if your company requires workers to use a VPN when working remotely, you’ve got your path to a quick fix! That’s because all VPN users should have the same IP address, so you just need to add a filter for it.
2. Setup cohort analysis
If you’ve followed any of our advice for immediate responses to the pandemic, you may have seen some differences in traffic to your website. The Cohort Analysis tool in Google Analytics offers an excellent way to see how a cohort of visitors (in this case, a group of visitors who saw your site for the first time on a particular day, week or month) has responded and interacted with you.
This too, which is currently in beta, can be a bit overwhelming upon first glance, but it is a great way to track key metrics over time. To use it, navigate to Audience > Cohort Analysis. By default, it will look something like this:
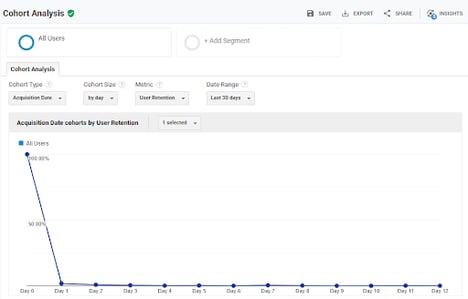
By changing the options at the top, you can dig into the data. The options include:
- Cohort Type: Right now, “Acquisition Date” is the only option in this field. Put simply, this is saying that you’re going to look at a group of visitors (a cohort) by the date on which you acquired them -- or the first time the visited the site.
- Cohort Size and Date Range: You can group visitors into a cohort based on the day, week, or month they first visited the site. Your option in this field will determine the rows that appear in the first column on the table. If you choose “Day,” you’ll see a row for each day; if you choose “Week,” you’ll see a column for each week, etc. How many days, weeks, or months appear depends on your setting in the “Date Range” field. If your cohort is defined “By Day,” and you set the “Date Range” to the “Last 7 Days,” you’ll see seven rows -- one for each of the last seven days. However, if you change the “Date Range” to “Last 30 Days,” you’ll now see 30 rows.
- Metric: This is where things really start to get interesting. The default selection here is “User Retention,” which will show you how likely visitors who were acquired during a certain period are to return in each subsequent period. However, you have lots of options under “Metric.” You can look at time on site, pages per visit, total pageviews, and goal completions.
As an example, this setup:
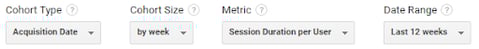
Will lead to this kind of report:
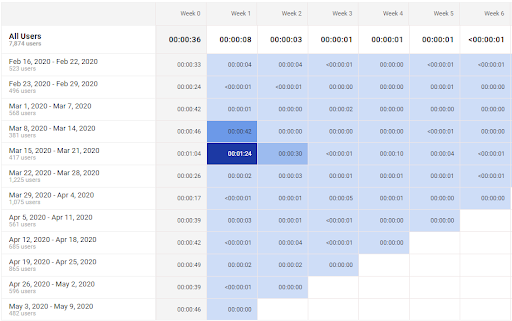
Which illustrates that users who saw this site for the first time during the week of March 15 - March 21 averaged just over 1 minute on the site during that first week. However, when they returned the second week, they averaged almost a minute and a half. Clearly, content or campaigns that brought visitors to the site the week of March 15 inspired them to return and stay even longer … and that’s the kind of content we want to keep creating.
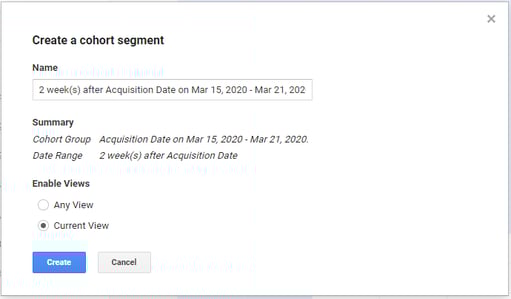
If you want to track additional metrics and trends from a cohort that first visited your site post-virus (or just after the start of any campaign), this report makes it incredibly simple. Just setup the report to have the timeframes you desire to track, and then click on the appropriate box on the report. For example, if you want to create a cohort of people who first acquired on a particular date and then visited again on a subsequent date, find the acquisition date row, and then the column for the subsequent date. Click that box, and you’ll be prompted to “Create a Cohort Segment” that can be used on any other report in Google Analytics.
Use search trends to generate new content
Your Google Analytics Acquisition reports will show you how people find your site and how that is changing over time. However, using this report is notoriously frustrating because most organic hits fall under “(not provided)” or “(not set).”
Despite this limitation, you can get some good information about changing interests.
First, use “landing page” as your primary dimension, instead of “keyword.”
In Google Analytics, navigate to Acquisition > All Traffic > Channels, and then click on “Organic Search.” Next, notice the “Primary Dimension” option between the graph and the table. By default, “Keyword” is selected there, but you can change this to “Landing Page.”
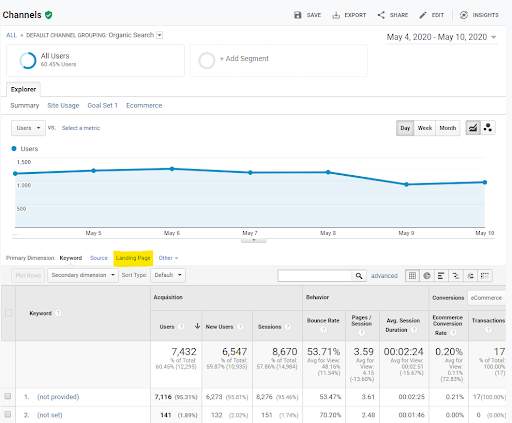
This report will now show you how popular your pages are in terms of driving organic search traffic to your site. While it won’t tell you specifically what each page ranked for, you can use Google Search Console to determine what terms included that page in their SERPs.
Assuming you have your Google Search Console report linked to your Google Analytics (and you should!), you can navigate to Acquisition > Search Console > Landing Pages. Find the URL for the page you want to analyze, and click it. This report will now show you the terms that page ranked for.
As a final step, determine if those terms are trending up or down by using Google Trends. Simply paste the search term into Google Trends, and then change the timeframe to the “Past 90 days.”
Repeat this process, and you’ll start to find terms that are trending upwards or downwards. Now, you know what you need to focus on for generating relevant and timely content. Working from home, free from the distractions of the office, might provide you the perfect opportunity to generate a bunch of blog posts.
Adjust PPC time of day
 With more people working from home, consumer habits are changing. Many sites are seeing more visits from Chrome on desktop, presumably because visitors are free to choose their own browser and device. (No more surreptitiously browsing on your phone while looking over your shoulder for nosey coworkers!) Tech companies are seeing longer session durations and more visits during normal business hours, in part because people have more time to do research.
For organic search, this may not mean much, but if you’re optimizing paid ads, timing can be extremely important. You can use the “Home” dashboard of Google Analytics to determine the most common time of day that users visit the site.
Google’s Ads tool will also help you analyze conversions by time of day. Using data from both of these reports, you should adjust your bids to the prime days and times.
Focus on current customers
For most technology companies, it costs significantly less to keep a current customer happy than to find a new one, so at least part of your marketing budget should be spent on customer retention and upselling.
Google Analytics isn’t able to differentiate between prospects and customers right out of the box, but that doesn’t mean that data isn’t important for customer retention. It just means that you need to do some extra work to get GA to give you the information you need. Depending on your digital properties and how “techy” you want to get, there are several methods for gathering customer data in GA.
Site search
If your website has a search tool, it can be a goldmine of information. If you have a support subdomain with a search tool, even better! While GA won’t specifically break out who is searching for what, it’s often pretty easy to see patterns and come to logical conclusions about who might be interested in what.
In order to use the Behavior > Site Search section of GA, you first need to configure it. This is done in the Admin tools under the View. There, you can click on “View Settings” and then turn on the “Site Search Tracking” option. Once turned on, you have to indicate your “Query Parameter.” This is just a fancy way of saying, “What comes after the question mark and before the equal sign on the URL of your search results page?” To determine that, just go do a search on your site and examine the URL that is used for the results. You might see something like:
www.example.com/?s=search-term
In that case the “s” (without the quotation marks) is your query parameter. Enter that in the “Query Parameter” field and click “Save.”
Now, the Site Search report will show you the various search terms used on your site. This can provide feedback about what areas of your software are most confusing, features of your product people want, and areas where site visitors might be confused. Focus on providing great answers and solutions for current customers.
User ID tracking
For sites where current users can log in -- whether to your SaaS product, a support section, an account management, or any other online tool -- it’s really easy to know who is a customer. If they login, they’re definitely a customer! (Of course, if they don’t login, they might still be a customer, so this metric is not 100% foolproof, but it can get you close.)
Google Analytics allows you to customize your tracking script and send a user ID that can be used to identify visitors as actual users, not just prospects. You’ll need to get a developer involved, as you need to have a unique variable per user that can be passed to GA. Once you’ve gotten it all setup, you’ll need to create a new View that will show you ONLY the visits from users with an ID. You can use this view to explore how current customers use your main site and any subdomains.
Segmentation
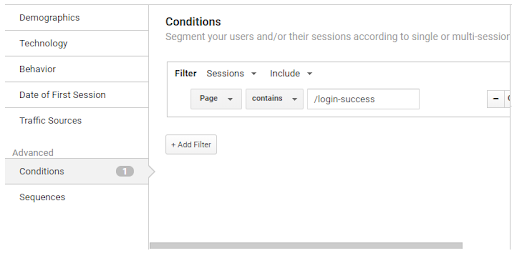
User ID tracking can be tricky since it usually requires a developer’s help. However, you can use segments to get close to the same result by creating two segments -- one for those visitors who have seen the “success” page that appears after a succesful login and one for those that have not. Again, it’s not foolproof, but it can help give you a rough idea of different user paths for different user types.
Segments are View-specific, so they are created there. Access the Admin screens for the tool, then click on “Segments” in the View column. You’ll want to use an “Advanced Condition” and set you filter based on “Page”:
Again, once you have this setup, you can use the GA reports to trace the behavior of users vs customers and compare each group’s activity pre and post virus or (pre and post any campaign you setup). The insights you glean here can help identify the most important marketing tasks for the next year -- and which are the most successful.
