


There are two types of people in the tech marketing world: those who dream in pivot tables and those who secretly wish a cyber attack on the makers of Excel.
Whatever your personality, data is imperative to the success of your tech business: you need it to make informed decisions at all stages of your sales funnel.
For many years, data and analytics were an afterthought…simply a “nice-to-have” component of doing business. However, in today’s era of information, being able to gather and understand data, as well as optimize your marketing strategy based on quantitative/qualitative details, will determine the success of your tech company.
So, what do I do with all this data?
Well, if you're like the other 53% of business execs who are data driven, it can be overwhelming and challenging to determine which data points to prioritize. Worried your tech business isn't stacking up, data-wise? Have no fear! We’ve outlined which metrics you should focus on, plus how to measure their key performance indicators (KPIs) to determine the success of your marketing.
Metrics vs. KPIs
What’s the difference between metrics and key performance indicators (KPIs)? While these terms are definitely related, many people use them interchangeably. There actually is a slight difference between the two, but don't worry about semantics if your business is naming things a different way.
- Metric: A unit of measurement (think visitors, leads, clicks, conversions, etc.)
- KPI: A specific measure of how effectively your marketing has improved a business metric
For example…
Say the goal of your marketing efforts is to pay less than $1 for every new website visitor.
- What metric should you measure? The number of new visitors to your website.
- What KPI should you use to determine how your marketing has affected that metric? Your cost per visit (CPV).
So, if you invested $4,500 in marketing, and acquired 5,000 new visitors to your site, the equation to calculate your KPI would look like this:
 Calculation | Kiwi Creative")
Congratulations: you’ve paid less than $1 per new visitor and your efforts have been successful…virtual fist bump!
What Data Should I Track for My Business?
Well…that all depends on your goal. Do you simply want to drive website traffic for brand awareness? Or, do you care most about lead generation? Or, maybe you're trying to specifically drive people toward registering for a live demo.
That said, here are four tried n' true KPIs that we think will benefit marketing professionals at all software and technology companies.
Traffic
Unlike 5:00 p.m. rush hour on a Friday, website traffic is a good thing. Traffic generally refers to the number of visits to your website, but it can also include phone calls or walk-ins. Increased website traffic will put more visitors at the top of your sales funnel, but be careful: quantity doesn't necessarily equate to quality.
Our favorite traffic-based KPI: Cost-per-Visitor (CPV)
Try using the CPV example above to measure how your own marketing spend has affected site traffic over the last six months. (As a reminder, that's monthly marketing spend ÷ # of monthly visitors.)
Keep tracking CPV in the future…see if you can reduce this KPI by a few cents each month.
When traffic-based KPIs are important:
- You're a startup or new brand focused on increasing brand awareness, but you also want to see some tangible insights into your business as you steadily grow.
- You're launching a new campaign and want to drive visitors to your website. Yes, you want new prospects to convert and bring in the big bucks, but measuring the effectiveness starts with attracting new traffic first! Cart, meet horse.
Leads
Leads are defined as engaged site visitors. They've shown interest in your brand by clicking on CTAs, downloading content offers or filling out a form on your website. They’re the visitors who are doing more research than just snooping around, but aren’t ready to purchase yet. While they may not be ready to pull the trigger and hand over those revenue dollars, these potential customers offer great insights into the effectiveness of your sales funnel.
Leads give you the opportunity to monitor consumer behaviors and then optimize based on their actions and engagements (or lack thereof).
Our favorite lead-based KPI: Cost-per-Lead (CPL) vs. Cost-per-Qualified-Lead (CPQL)
The most commonly used KPI for measuring lead volume efficiency is cost-per-lead (CPL). Some leads are more qualified than others, and many businesses use additional KPIs to measure more qualified leads. These KPIs are referred to as cost-per-qualified-lead (CPQL). Let’s look at an example of both.
CPL Example
Remember those $4,500 marketing dollars you invested that drove 5,000 new visitors to your website? Of those 5,000 visitors, let’s say that 50 became new leads. Do the math and you'll quickly see that you're paying $90/lead.
 Calculation | Kiwi Creative")
CPQL Example
How you define a “qualified” CPL will vary greatly from company to company, and even channel to channel. It will also depend on factors that are unique to your business, such as price point, sales cycle and expected value that a lead may bring in the future.
“Qualified leads” are simply leads that meet these pre-determined criteria. For instance, let’s say you have historical data supporting that a prospect has an 80% higher chance of converting if a sales call lasts more than 5 minutes.
Now let’s say, of those 50 new leads mentioned above, five of them are qualified based on 5+ minute phone calls and are likely to convert to a sale. That's $900/CPQL.
 Calculation | Kiwi Creative")
When lead-based KPIs are important:
- You have a long sales cycle (that's the norm for tech!), so leads need to be nurtured with educational, and maybe even entertaining, content. Test different marketing tactics to help move them further down the funnel.
- You already know the qualifying attributes of your leads. If you have historical knowledge on which types of prospects are more likely to convert, focus your time, energy and budget on this audience first. Dig into why some customers lack qualifying attributes and test different strategies to get 'em qualified.
Want to drive more traffic, leads, and opportunity to gather all this data and numbers to crunch? Check out our B2B Tech Marketer's Guide to Inbound!
Conversion
Traffic is strong, prospects are intrigued…now, focus on turning those leads into tech customers!
Our favorite conversion-based KPI: Cost-per-Acquisition (CPA)
Businesses have many words for newly acquired customers, so you may hear many different names for KPIs that refer to the cost of a conversion. At our agency, we refer to this as cost-per-acquisition (CPA). No, these CPAs won’t do your taxes, but they will tell you how efficiently you have been able to make a sale.
CPA Example
In our example, there were five extremely qualified leads, and, based on historical data, we know that 80% of those qualified leads are likely to convert to sales. That means that your actual cost-per-acquisition is $1,125.
 Calculation | Kiwi Creative")
When conversion-based KPIs are important:
- You have a specific offer as your call-to-action (CTA), which you want to test. A good CPA will suggest a strong CTA, while a poor CPA will imply that your CTA (or the offer itself) isn’t working. You guessed it — time to optimize!
- You've already optimized your earlier KPIs, so driving volume is no longer the goal, but rather efficiency is the main objective.
Revenue
This is where the money’s at…but a couple of factors determine if you should actually use it as your primary KPI.
If you're trying to measure long-term initiatives, like a website redesign, it will take a long time to see a return on your investment. However, if you're trying to measure short-term tactics, like PPC, getting your money back quickly is a priority.
Our favorite revenue-based KPI: Return on Investment (ROI)
ROI, or return on investment, is arguably the holy grail of all KPIs. It tells you the amount of revenue you received based on the amount of money you invested. It can be reported as a percentage (150% ROI) or as a decimal value (1.50 ROI).
Want to get more advanced? Another way to evaluate revenue in regards to the sales funnel is through average order value (AOV). This helps quantify how valuable your average customer is. From here, you can look at the lifetime value (LTV) of a customer and determine if the value, in the long run, is greater than the value in the short run.
ROI Example
Previously, we determined that out of 5,000 new website visitors, 50 became leads, and five were qualified leads. Of those five qualified leads, four ended up converting to sales for a CPA of $1,125. You may say, “That’s way more than I am willing to spend on a new customer!” But, let’s say that each new customer brings in $2,500 in revenue in the first year. That’s $10,000 in revenue ($2,500 x four customers). And overall, 222% is a pretty fine return on investment!
 Calculation | Kiwi Creative")
When revenue-based KPIs are important:
- Your products or services carry a hefty price tag, meaning you may only get a couple of sales in a given time period. In this case, your focus should be on the quality of each of those leads aka ROI.
- You need to improve your bottom line. You want deeper insights to help determine profitability and how your efforts are affecting the bottom line. Keeping all of the other metrics and possible optimizations in mind, if you need to improve profit margins, revenue needs to be your goal. Keep in mind, however, the metrics in the previous stages of the funnel (traffic, leads, conversions) need to be in place as well.
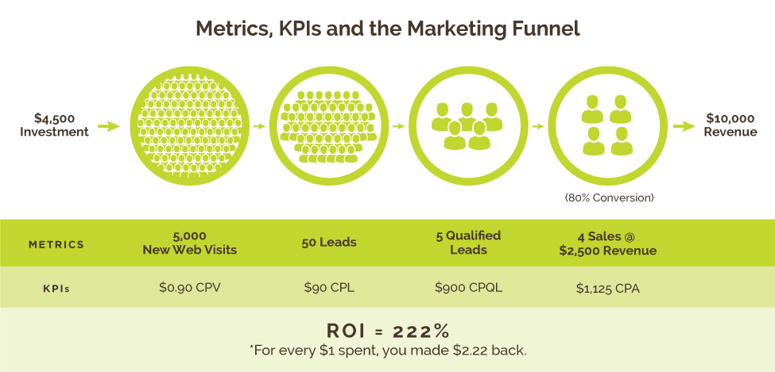
Putting it All Together
Remember our original point about metrics vs. KPIs, and how a $4,500 investment could result in 222% ROI? Here's a better look at that specific funnel.
Big Data = Bigger Insights
As you can see, there are many factors that will affect how you measure and evaluate the effectiveness of your marketing performance. Changes in the technology marketplace, current events and even weather or time of day all have the potential to impact your customer’s behavior and, in turn, your data. It’s important to stay focused on all of your goals, reevaluate as necessary and use data to improve your initiatives.
As your business grows, you’ll find yourself caring more about some KPIs than others. Your biggest goal this year may be driving traffic, so you’ll focus on optimizing your CPV. A year from now, you may have a steady pace of traffic and want to adjust your focus to your CPA.
